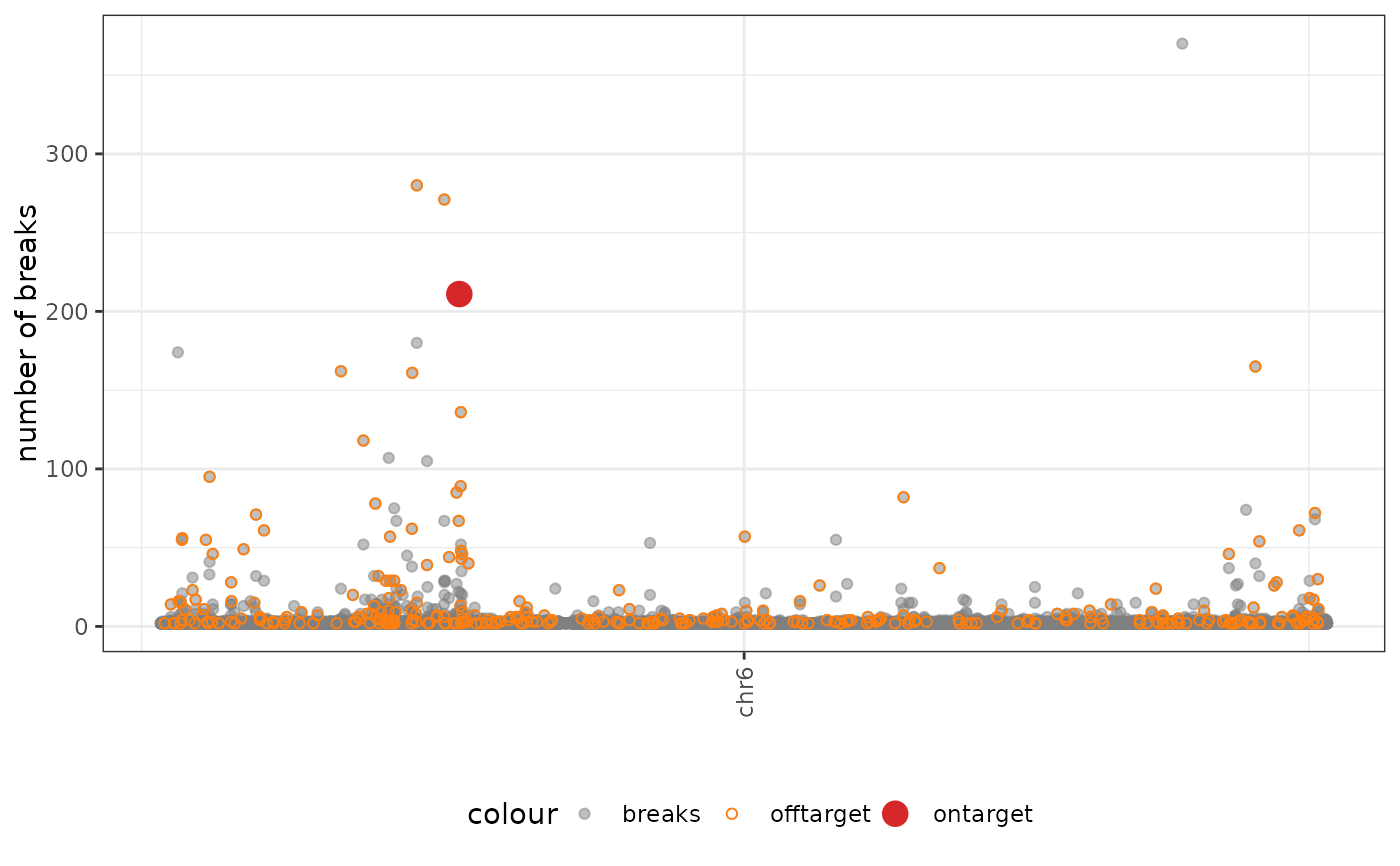
plot_genomic_position Plot the genomic position of the breaks, identifying detected on-/off-targets.
plot_genomic_position.Rdplot_genomic_position Plot the genomic position of the breaks, identifying detected on-/off-targets.
Usage
plot_genomic_position(
  x,
  target,
  bsgenome,
  standard_chromosomes = TRUE,
  min_breaks = 2,
  log_signal = FALSE,
  verbose = TRUE
)
Arguments
- x
A GRanges object containing the results of a breakinspectoR analysis. Possibly filtered (eg. qval < .01).
- target
GRanges object with coordinates of breaks in the targeted library, or a character with the path to a bed file.
- bsgenome
character, bsgenome to use (eg. BSgenome.Hsapiens.UCSC.hg38).
- standard_chromosomes
logical, constrain the analysis to standard chromosomes only. Default: TRUE.
- min_breaks
minimum number of breaks in the cutsite to be considered for the analysis. Default: 2.
- log_signal
display log10 transformed signal. Default: FALSE.
- verbose
logical, keep informing about every step.
Examples
if (FALSE) { # \dontrun{
  offtargets <- breakinspectoR(
    target   =system.file("extdata/vegfa.chr6.bed.gz", package="breakinspectoR"),
    nontarget=system.file("extdata/nontarget.chr6.bed.gz", package="breakinspectoR"),
    guide    ="GACCCCCTCCACCCCGCCTC",
    PAM      =c("NGG", "NAG"),
    bsgenome ="BSgenome.Hsapiens.UCSC.hg38",
    cutsiteFromPAM=3
  )
} # }
data(breakinspectoR_examples)

plot_genomic_position(
  offtargets,
  target   =system.file("extdata/vegfa.chr6.bed.gz", package="breakinspectoR"),
  bsgenome ="BSgenome.Hsapiens.UCSC.hg38"
)
#> Loading BSgenome.Hsapiens.UCSC.hg38...
#>  done
#> Importing breaks...
#>  done