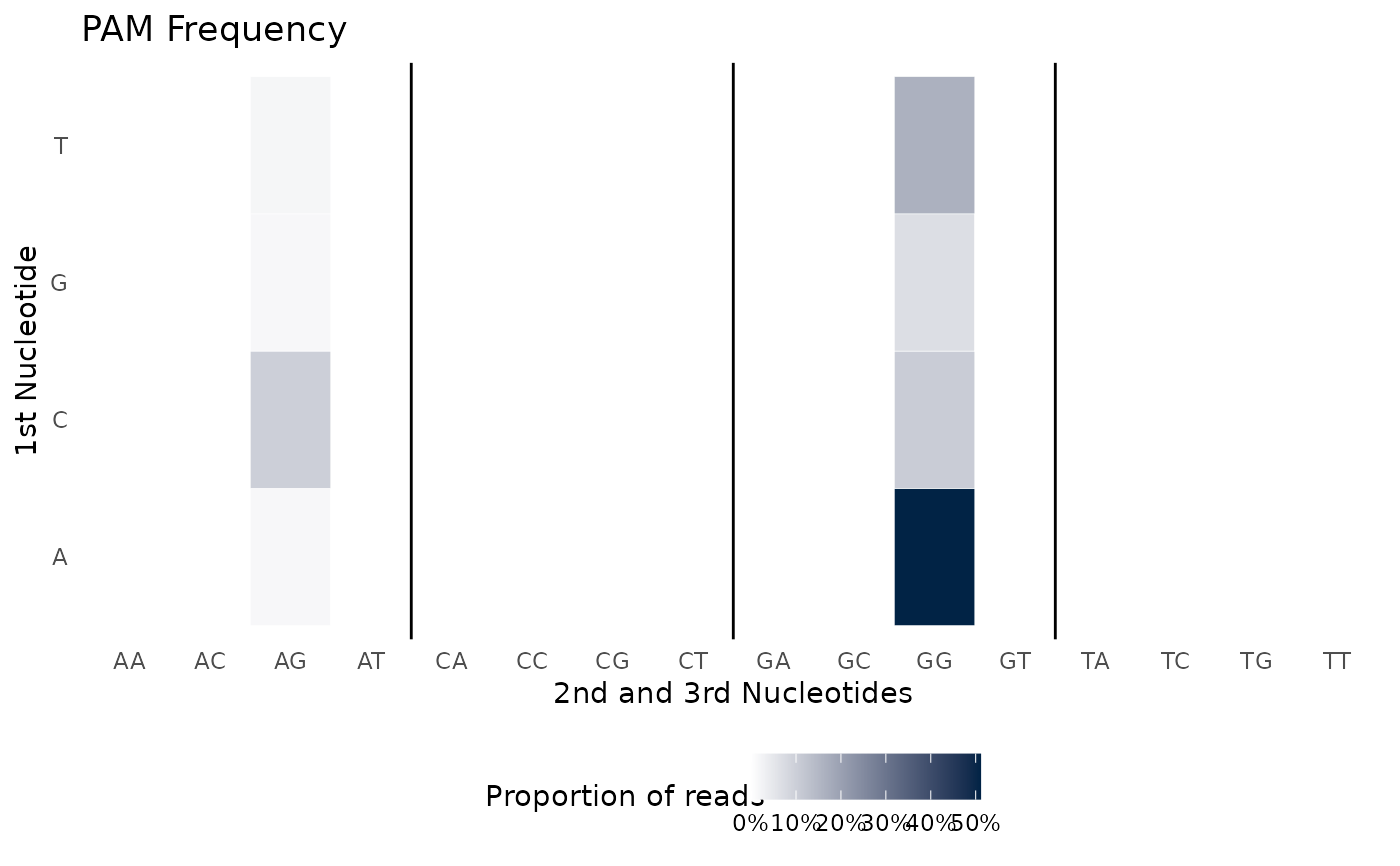
plot_pam_composition Plots the proportion nucleotide usage per position of the PAM.
plot_pam_composition.Rdplot_pam_composition Plots the proportion nucleotide usage per position of the PAM.
Examples
if (FALSE) { # \dontrun{
  offtargets <- breakinspectoR(
    target   =system.file("extdata/vegfa.chr6.bed.gz", package="breakinspectoR"),
    nontarget=system.file("extdata/nontarget.chr6.bed.gz", package="breakinspectoR"),
    guide    ="GACCCCCTCCACCCCGCCTC",
    PAM      =c("NGG", "NAG"),
    bsgenome ="BSgenome.Hsapiens.UCSC.hg38",
    cutsiteFromPAM=3
  )
} # }
data(breakinspectoR_examples)

plot_pam_composition(offtargets)