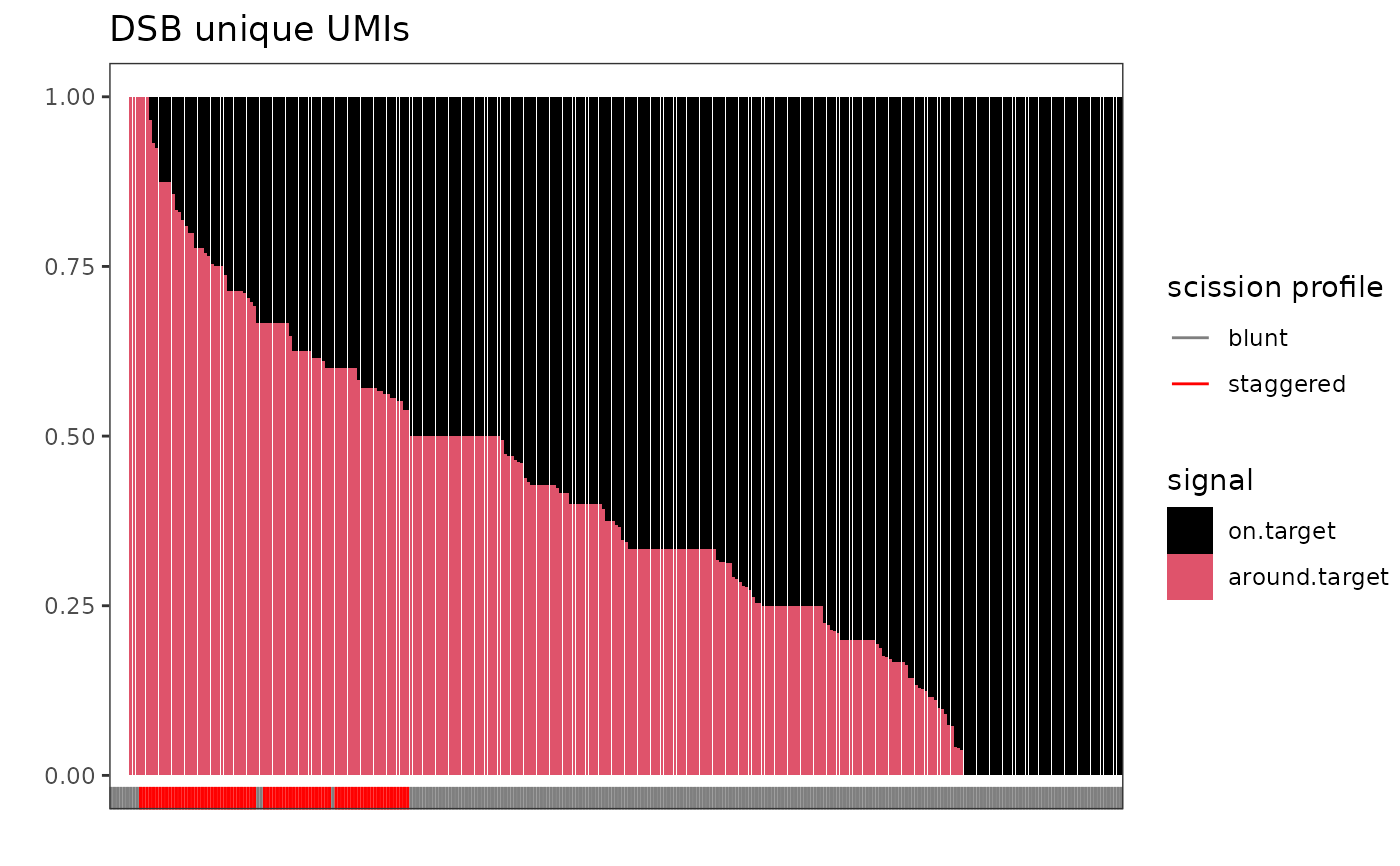
plot_scission_profile Plot ratios of blunt vs. staggered signal for each OT detected.
plot_scission_profile.Rdplot_scission_profile Plot ratios of blunt vs. staggered signal for each OT detected.
Usage
plot_scission_profile(x, type = c("frequency", "absolute"))Examples
if (FALSE) { # \dontrun{
  offtargets <- breakinspectoR(
    target   =system.file("extdata/vegfa.chr6.bed.gz", package="breakinspectoR"),
    nontarget=system.file("extdata/nontarget.chr6.bed.gz", package="breakinspectoR"),
    guide    ="GACCCCCTCCACCCCGCCTC",
    PAM      =c("NGG", "NAG"),
    bsgenome ="BSgenome.Hsapiens.UCSC.hg38",
    cutsiteFromPAM=3
  )

  offtargets.scission_profile <- scission_profile_analysis(
    x        =offtargets,
    target   =system.file("extdata/vegfa.chr6.bed.gz", package="breakinspectoR"),
    nontarget=system.file("extdata/nontarget.chr6.bed.gz", package="breakinspectoR"),
    bsgenome ="BSgenome.Hsapiens.UCSC.hg38")
} # }
data(breakinspectoR_examples)

plot_scission_profile(offtargets.scission_profile)
#> Warning: Removed 12 rows containing missing values or values outside the scale range
#> (`geom_bar()`).